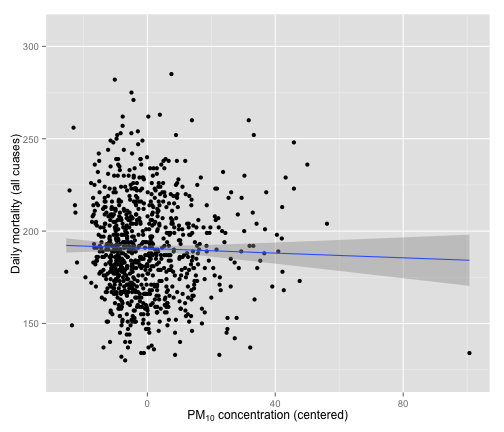
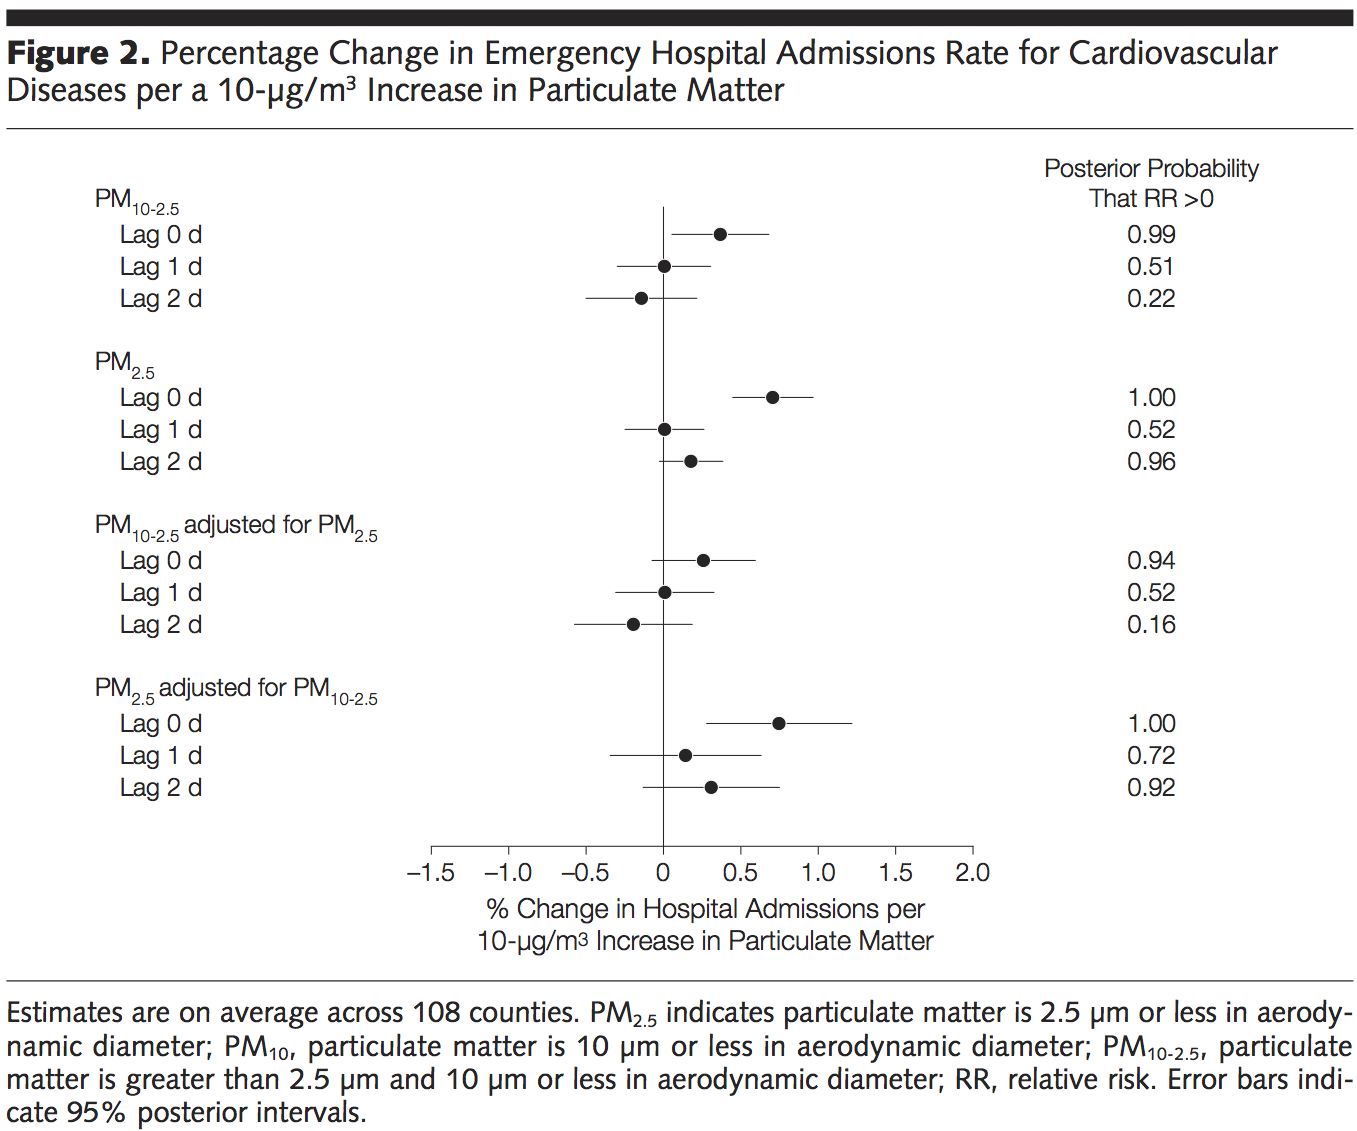
Principle 1: Show comparisons
- Evidence for a hypothesis is always relative to another competing hypothesis.
- Always ask "Compared to What?"
Principles of Analytic Graphics
Roger D. Peng, Associate Professor of Biostatistics
Johns Hopkins Bloomberg School of Public Health
Principles of Analytic Graphics
Show Comparisons

Reference: Butz AM, et al., JAMA Pediatrics, 2011.
Show Comparisons

Reference: Butz AM, et al., JAMA Pediatrics, 2011.
Principles of Analytic Graphics
Principle 1: Show comparisons
- Evidence for a hypothesis is always relative to another competing hypothesis.
- Always ask "Compared to What?"
Principle 2: Show causality, mechanism, explanation, systematic structure
- What is your causal framework for thinking about a question?
Show causality, mechanism

Reference: Butz AM, et al., JAMA Pediatrics, 2011.
Show causality, mechanism

Reference: Butz AM, et al., JAMA Pediatrics, 2011.
Principles of Analytic Graphics
Principle 1: Show comparisons
- Evidence for a hypothesis is always relative to another competing hypothesis.
- Always ask "Compared to What?"
Principle 2: Show causality, mechanism, explanation, systematic structure
- What is your causal framework for thinking about a question?
Principle 3: Show multivariate data
- Multivariate = more than 2 variables
- The real world is multivariate
- Need to "escape flatland"
Show Multivariate Data

Show Multivariate Data

Principles of Analytic Graphics
Principle 4: Integration of evidence
- Completely integrate words, numbers, images, diagrams
- Data graphics should make use of many modes of data presentation
- Don't let the tool drive the analysis
Integrate Different Modes of Evidence

Principles of Analytic Graphics
Principle 4: Integration of evidence
- Completely integrate words, numbers, images, diagrams
- Data graphics should make use of many modes of data presentation
- Don't let the tool drive the analysis
Principle 5: Describe and document the evidence with appropriate labels, scales, sources, etc.
- A data graphic should tell a complete story that is credible
Principle 6: Content is king
- Analytical presentations ultimately stand or fall depending on the quality, relevance, and integrity of their content
Summary
- Principle 1: Show comparisons
- Principle 2: Show causality, mechanism, explanation
- Principle 3: Show multivariate data
- Principle 4: Integrate multiple modes of evidence
- Principle 5: Describe and document the evidence
- Principle 6: Content is king
References
Edward Tufte (2006). Beautiful Evidence, Graphics Press LLC. www.edwardtufte.com