- How do we define close?
- How do we group things?
- How do we visualize the grouping?
- How do we interpret the grouping?
K-means Clustering
Roger D. Peng, Associate Professor of Biostatistics
Johns Hopkins Bloomberg School of Public Health
Can we find things that are close together?
How do we define close?
- Most important step
- Garbage in \(\longrightarrow\) garbage out
- Distance or similarity
- Continuous - euclidean distance
- Continous - correlation similarity
- Binary - manhattan distance
- Pick a distance/similarity that makes sense for your problem
K-means clustering
- A partioning approach
- Fix a number of clusters
- Get "centroids" of each cluster
- Assign things to closest centroid
- Reclaculate centroids
- Requires
- A defined distance metric
- A number of clusters
- An initial guess as to cluster centroids
- Produces
- Final estimate of cluster centroids
- An assignment of each point to clusters
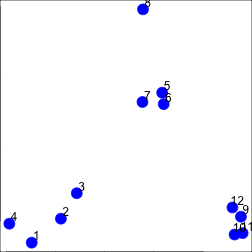
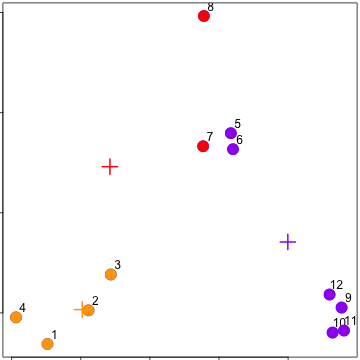
K-means clustering - example
set.seed(1234)
par(mar = c(0, 0, 0, 0))
x <- rnorm(12, mean = rep(1:3, each = 4), sd = 0.2)
y <- rnorm(12, mean = rep(c(1, 2, 1), each = 4), sd = 0.2)
plot(x, y, col = "blue", pch = 19, cex = 2)
text(x + 0.05, y + 0.05, labels = as.character(1:12))
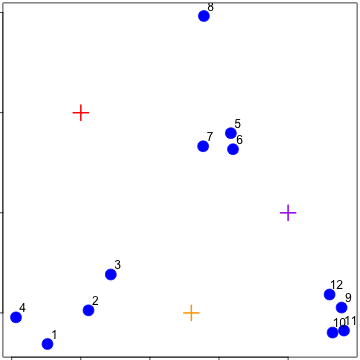
K-means clustering - starting centroids
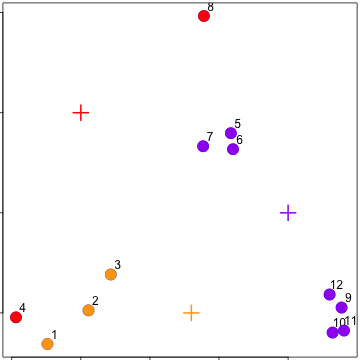
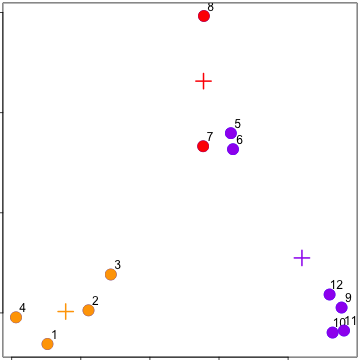
K-means clustering - assign to closest centroid
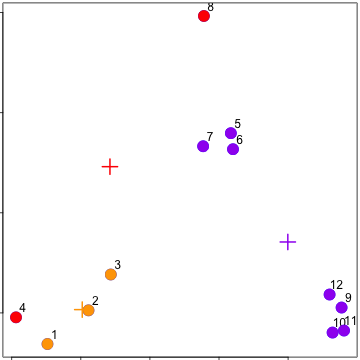
K-means clustering - recalculate centroids
K-means clustering - reassign values
K-means clustering - update centroids
kmeans()
- Important parameters: x, centers, iter.max, nstart
dataFrame <- data.frame(x, y)
kmeansObj <- kmeans(dataFrame, centers = 3)
names(kmeansObj)
## [1] "cluster"      "centers"      "totss"        "withinss"
## [5] "tot.withinss" "betweenss"    "size"         "iter"
## [9] "ifault"
kmeansObj$cluster
## [1] 3 3 3 3 1 1 1 1 2 2 2 2
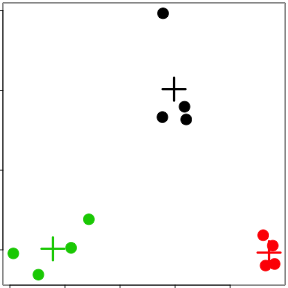
kmeans()
par(mar = rep(0.2, 4))
plot(x, y, col = kmeansObj$cluster, pch = 19, cex = 2)
points(kmeansObj$centers, col = 1:3, pch = 3, cex = 3, lwd = 3)
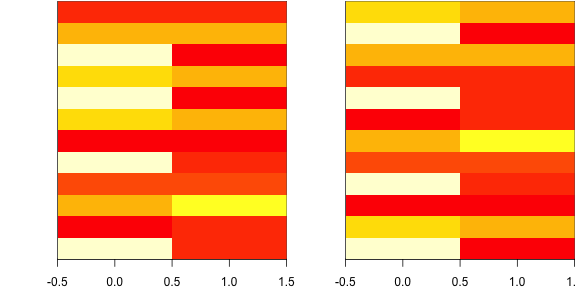
Heatmaps
set.seed(1234)
dataMatrix <- as.matrix(dataFrame)[sample(1:12), ]
kmeansObj2 <- kmeans(dataMatrix, centers = 3)
par(mfrow = c(1, 2), mar = c(2, 4, 0.1, 0.1))
image(t(dataMatrix)[, nrow(dataMatrix):1], yaxt = "n")
image(t(dataMatrix)[, order(kmeansObj$cluster)], yaxt = "n")
Notes and further resources
- K-means requires a number of clusters
- Pick by eye/intuition
- Pick by cross validation/information theory, etc.
- Determining the number of clusters
- K-means is not deterministic
- Different # of clusters
- Different number of iterations
- Rafael Irizarry's Distances and Clustering Video
- Elements of statistical learning