- Data
- Raw data
- Processed data
- Figures
- Exploratory figures
- Final figures
- R code
- Raw / unused scripts
- Final scripts
- R Markdown files
- Text
- README files
- Text of analysis / report
Organizing a Data Analysis
Roger D. Peng, Associate Professor of Biostatistics
Johns Hopkins Bloomberg School of Public Health
Data analysis files
Raw Data
- Should be stored in your analysis folder
- If accessed from the web, include url, description, and date accessed in README
Processed data
- Processed data should be named so it is easy to see which script generated the data.
- The processing script - processed data mapping should occur in the README
- Processed data should be tidy
Exploratory figures
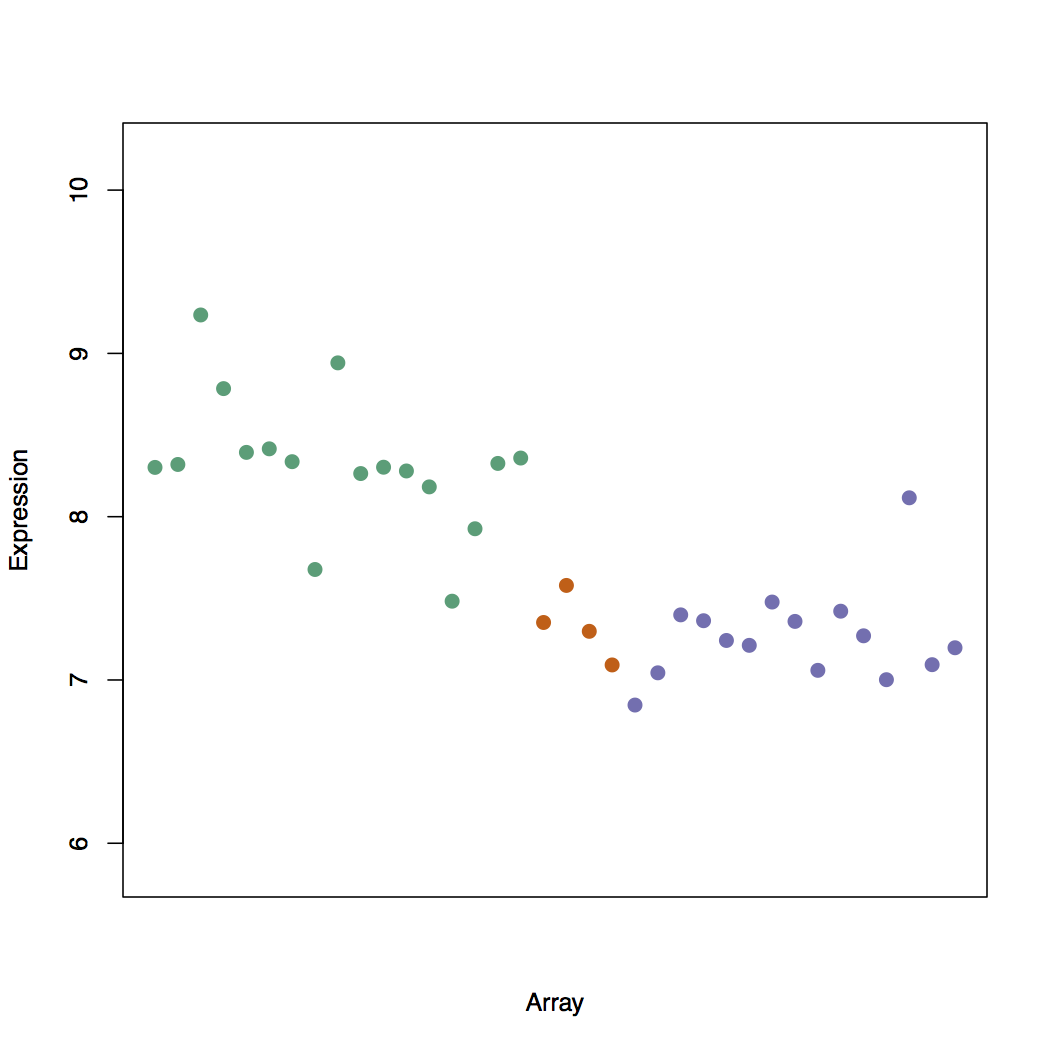
- Figures made during the course of your analysis, not necessarily part of your final report.
- They do not need to be "pretty"
Final Figures
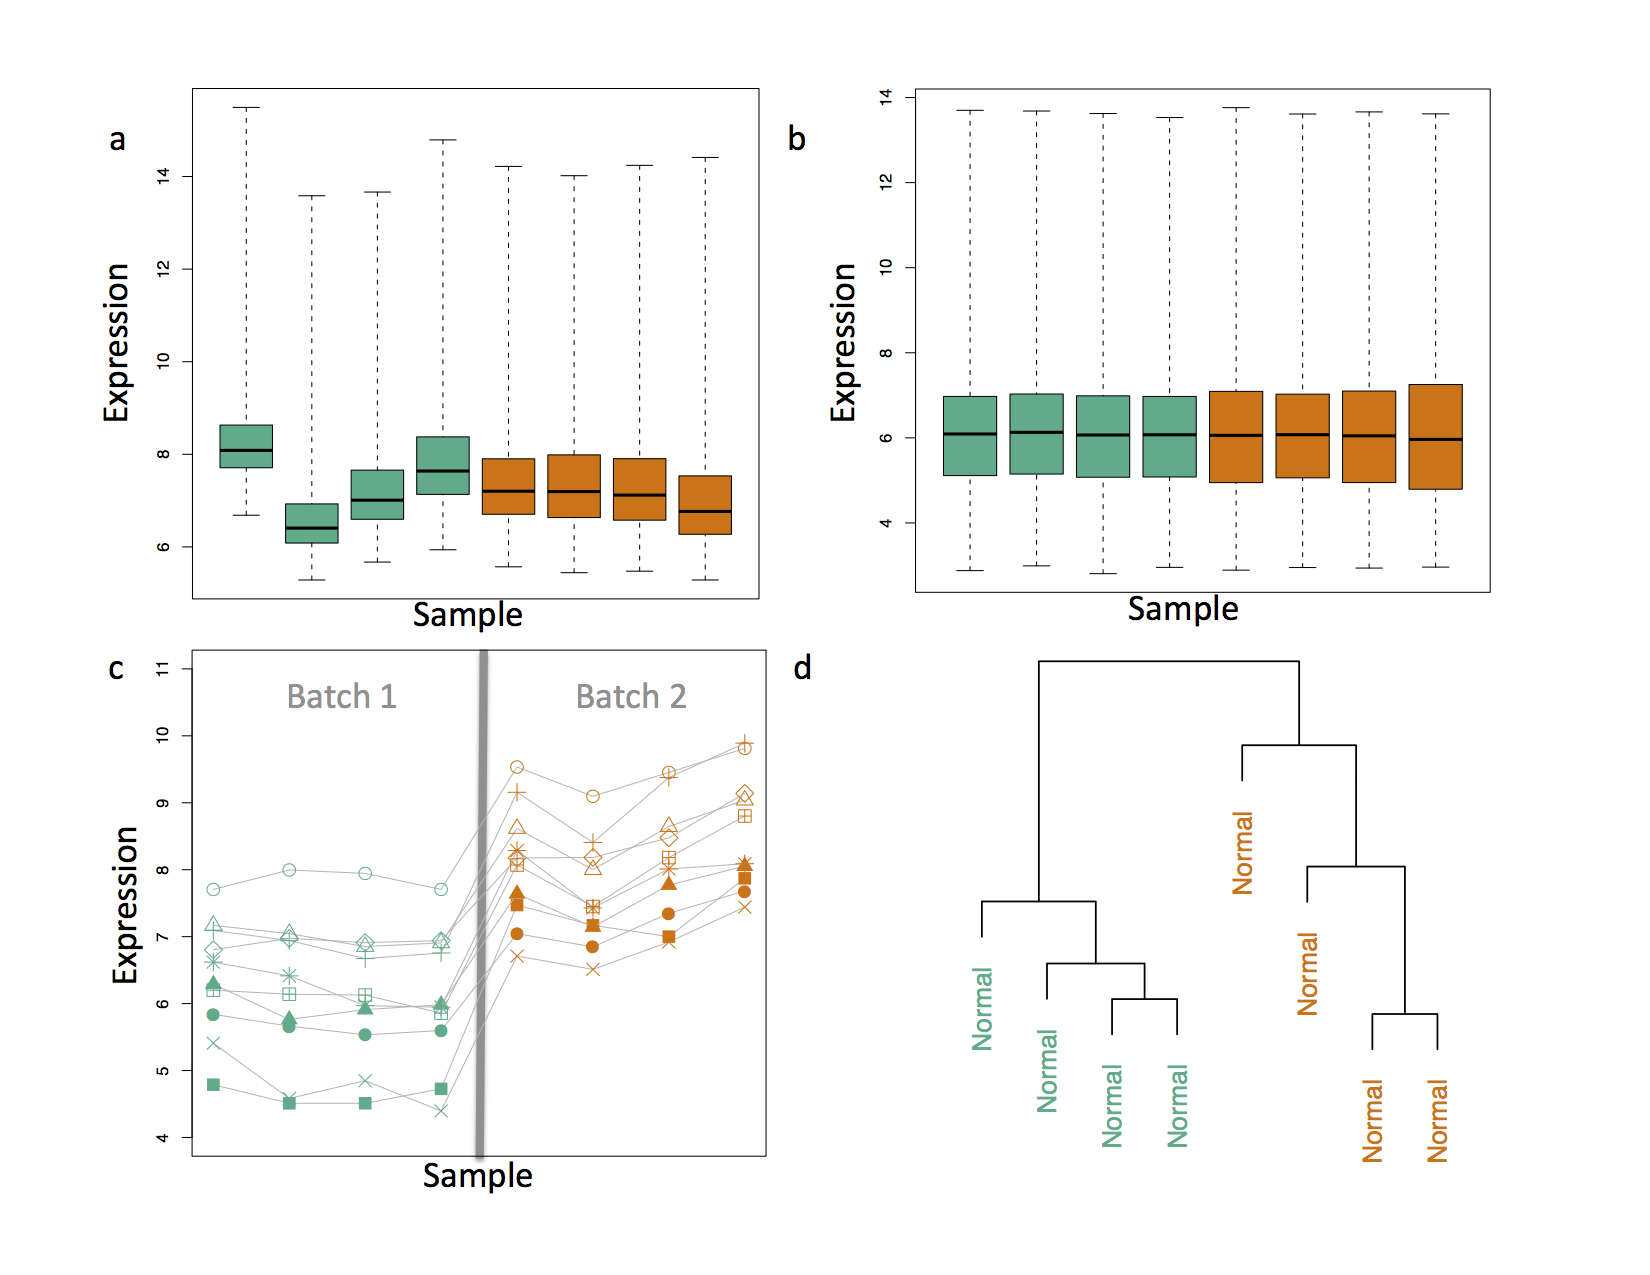
- Usually a small subset of the original figures
- Axes/colors set to make the figure clear
- Possibly multiple panels
Raw scripts
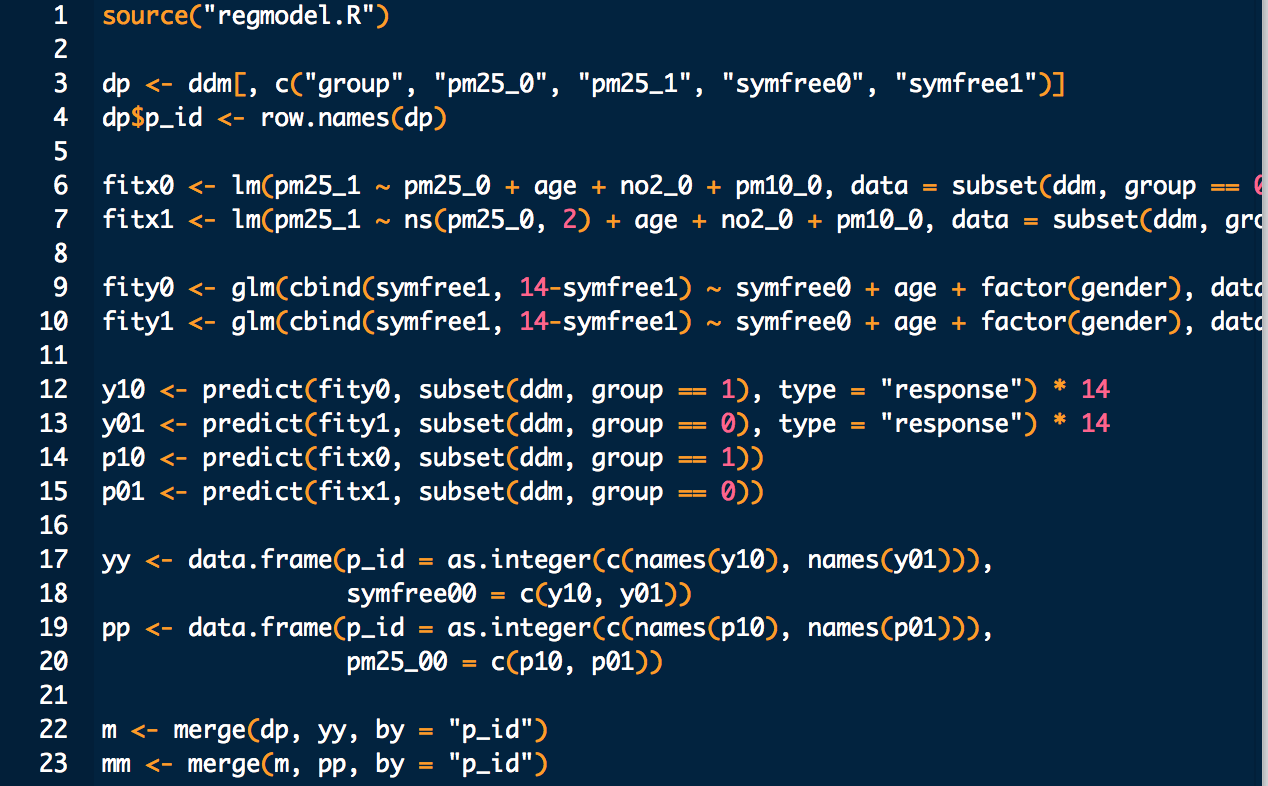
- May be less commented (but comments help you!)
- May be multiple versions
- May include analyses that are later discarded
Final scripts
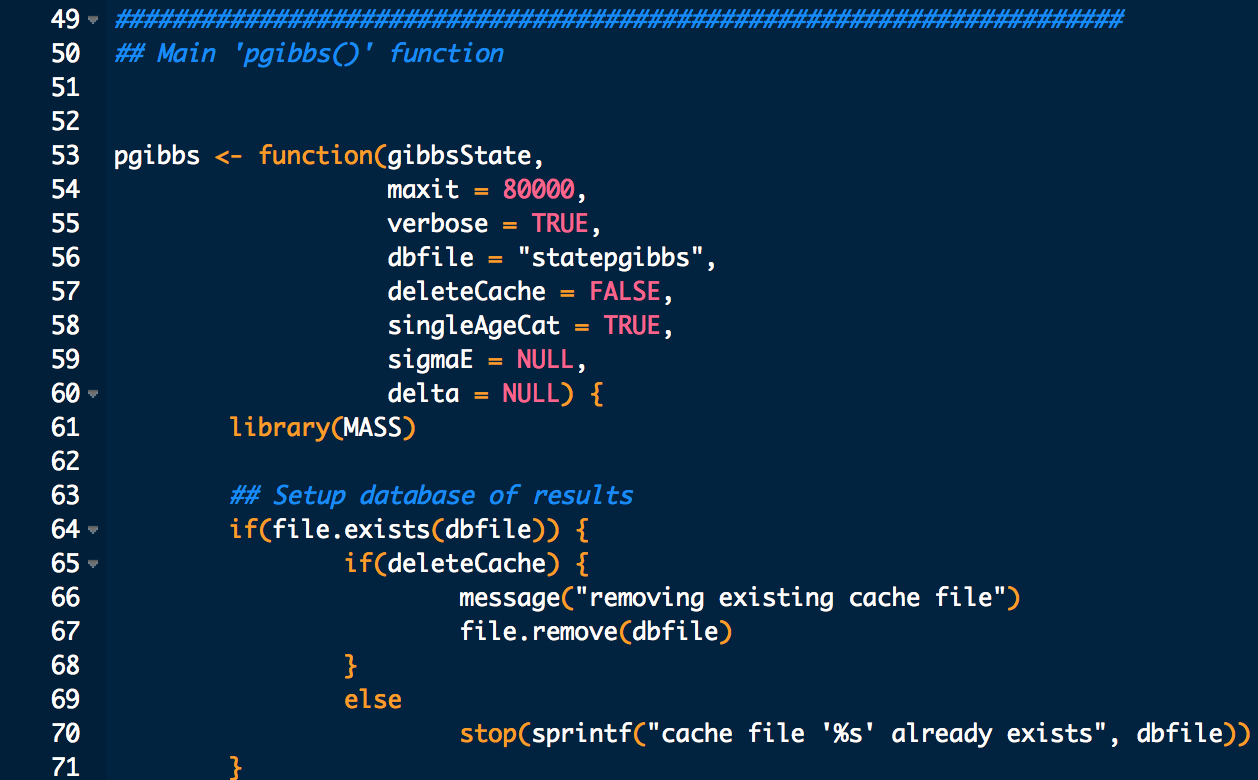
- Clearly commented
- Small comments liberally - what, when, why, how
- Bigger commented blocks for whole sections
- Include processing details
- Only analyses that appear in the final write-up
R markdown files

- R markdown files can be used to generate reproducible reports
- Text and R code are integrated
- Very easy to create in Rstudio
Readme files

- Not necessary if you use R markdown
- Should contain step-by-step instructions for analysis
- Here is an example https://github.com/jtleek/swfdr/blob/master/README
Text of the document

- It should include a title, introduction (motivation), methods (statistics you used), results (including measures of uncertainty), and conclusions (including potential problems)
- It should tell a story
- It should not include every analysis you performed
- References should be included for statistical methods
Further resources
- Information about a non-reproducible study that led to cancer patients being mistreated: The Duke Saga Starter Set
- Reproducible research and Biostatistics
- Managing a statistical analysis project guidelines and best practices
- Project template - a pre-organized set of files for data analysis