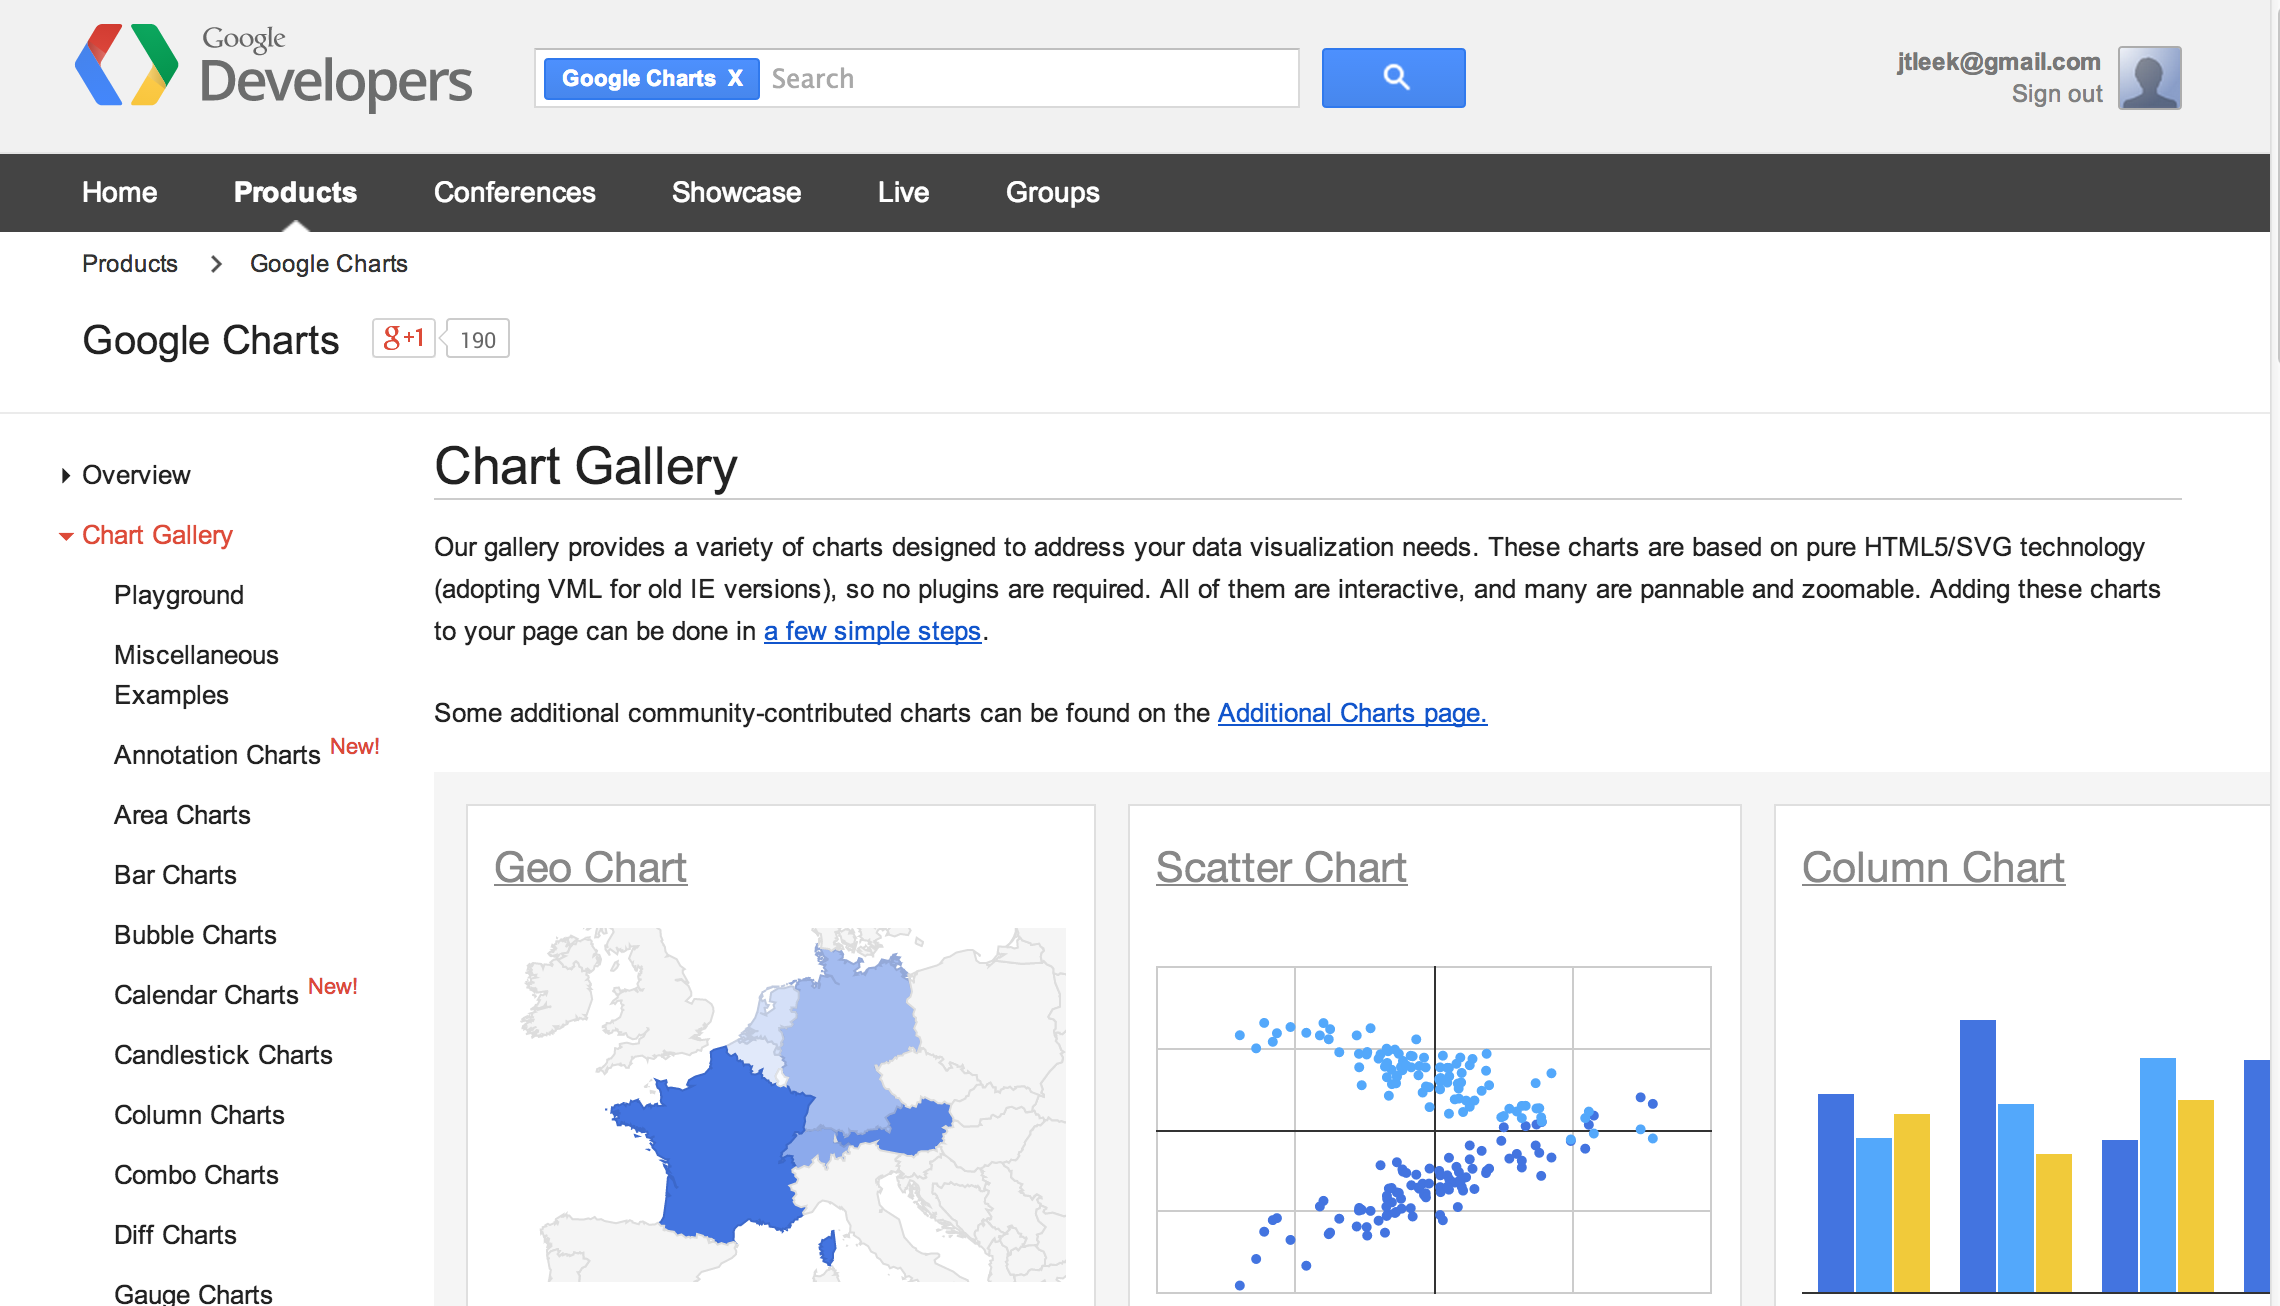
https://developers.google.com/chart/interactive/docs/gallery
https://developers.google.com/chart/interactive/docs/gallery
suppressPackageStartupMessages(library(googleVis))
M <- gvisMotionChart(Fruits, "Fruit", "Year",
                     options=list(width=600, height=400))
print(M,"chart")
gvisMotionChartgvisGeoChartgvisTablegvisLineChartgvisColumnChartgvisTreeMaphttp://cran.r-project.org/web/packages/googleVis/googleVis.pdf
G <- gvisGeoChart(Exports, locationvar="Country",
                  colorvar="Profit",options=list(width=600, height=400))
print(G,"chart")
G2 <- gvisGeoChart(Exports, locationvar="Country",
                  colorvar="Profit",options=list(width=600, height=400,region="150"))
print(G2,"chart")
options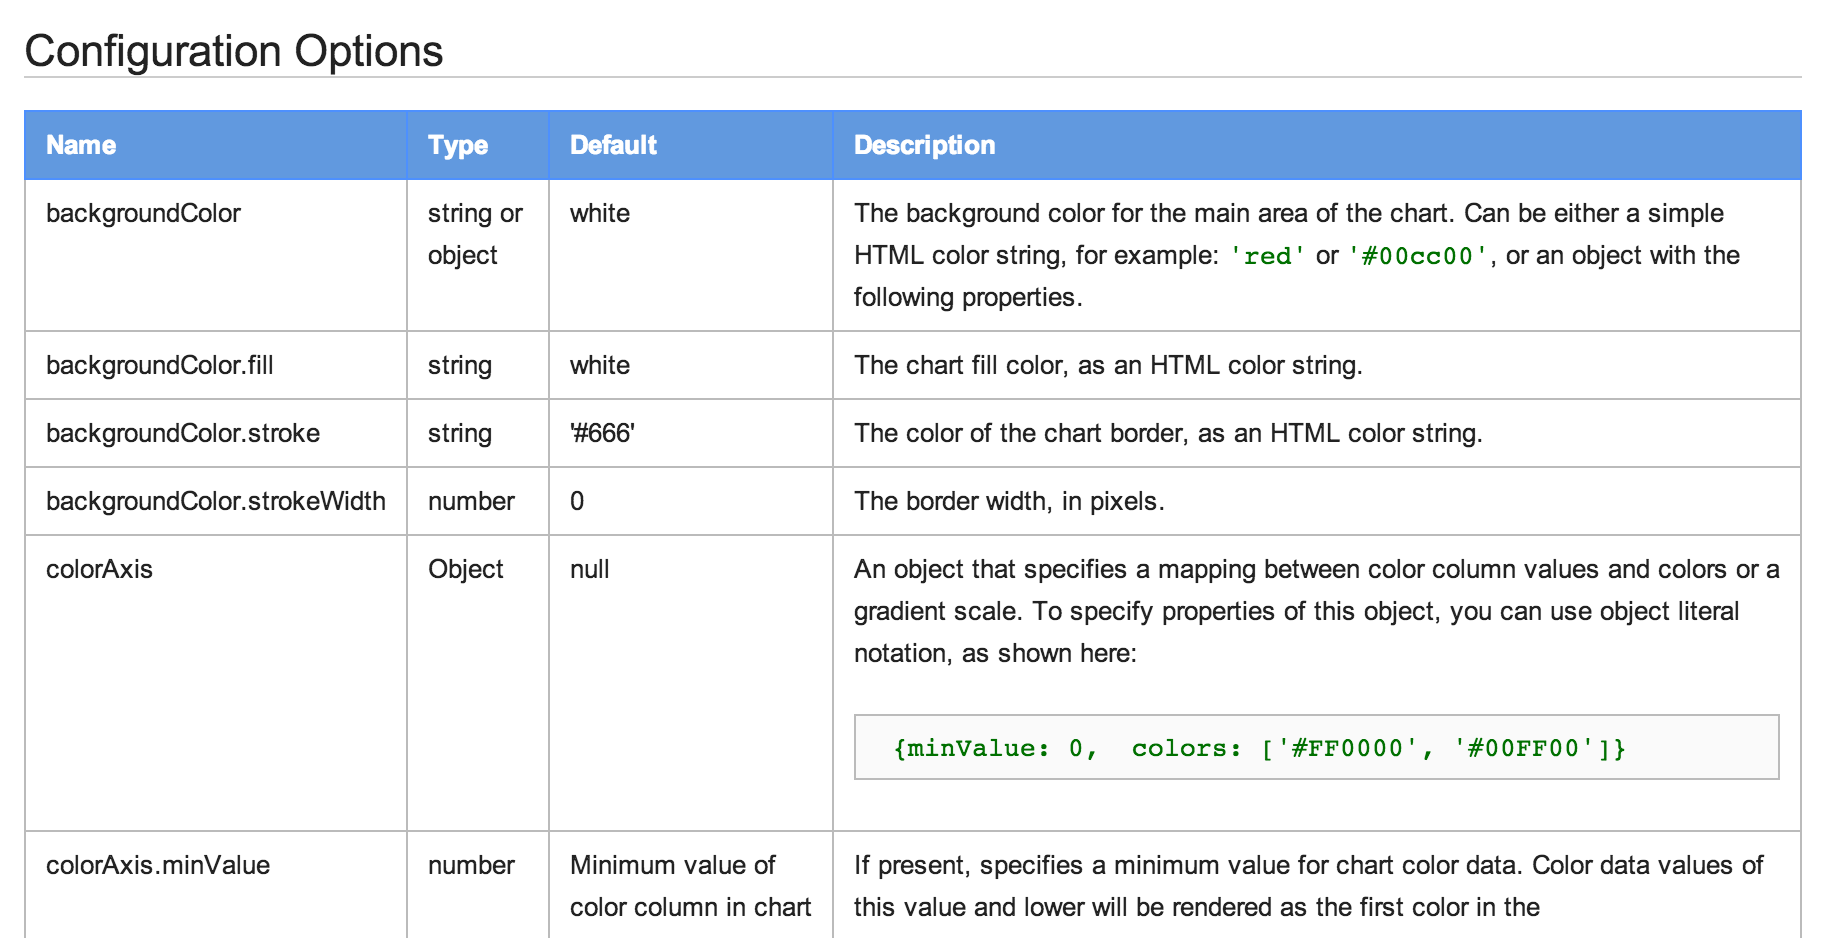
https://developers.google.com/chart/interactive/docs/gallery/geochart
df <- data.frame(label=c("US", "GB", "BR"), val1=c(1,3,4), val2=c(23,12,32))
Line <- gvisLineChart(df, xvar="label", yvar=c("val1","val2"),
        options=list(title="Hello World", legend="bottom",
                titleTextStyle="{color:'red', fontSize:18}",
                vAxis="{gridlines:{color:'red', count:3}}",
                hAxis="{title:'My Label', titleTextStyle:{color:'blue'}}",
                series="[{color:'green', targetAxisIndex: 0},
                         {color: 'blue',targetAxisIndex:1}]",
                vAxes="[{title:'Value 1 (%)', format:'##,######%'},
                                  {title:'Value 2 (\U00A3)'}]",
                curveType="function", width=500, height=300
                ))
https://github.com/mages/Introduction_to_googleVis/blob/gh-pages/index.Rmd
print(Line,"chart")
G <- gvisGeoChart(Exports, "Country", "Profit",options=list(width=200, height=100))
T1 <- gvisTable(Exports,options=list(width=200, height=270))
M <- gvisMotionChart(Fruits, "Fruit", "Year", options=list(width=400, height=370))
GT <- gvisMerge(G,T1, horizontal=FALSE)
GTM <- gvisMerge(GT, M, horizontal=TRUE,tableOptions="bgcolor=\"#CCCCCC\" cellspacing=10")
print(GTM,"chart")
|
|
M <- gvisMotionChart(Fruits, "Fruit", "Year", options=list(width=600, height=400))
print(M)
## <!DOCTYPE html PUBLIC "-//W3C//DTD XHTML 1.0 Strict//EN"
## "http://www.w3.org/TR/xhtml1/DTD/xhtml1-strict.dtd">
## <html xmlns="http://www.w3.org/1999/xhtml">
## <head>
## <title>MotionChartID2bc62925ee46</title>
## <meta http-equiv="content-type" content="text/html;charset=utf-8" />
## <style type="text/css">
## body {
## color: #444444;
## font-family: Arial,Helvetica,sans-serif;
## font-size: 75%;
## }
## a {
## color: #4D87C7;
## text-decoration: none;
## }
## </style>
## </head>
## <body>
## <!-- MotionChart generated in R 3.3.1 by googleVis 0.6.0 package -->
## <!-- Fri Aug 26 10:36:00 2016 -->
##
##
## <!-- jsHeader -->
## <script type="text/javascript">
##
## // jsData
## function gvisDataMotionChartID2bc62925ee46 () {
## var data = new google.visualization.DataTable();
## var datajson =
## [
## [
## "Apples",
## 2008,
## "West",
## 98,
## 78,
## 20,
## "2008-12-31"
## ],
## [
## "Apples",
## 2009,
## "West",
## 111,
## 79,
## 32,
## "2009-12-31"
## ],
## [
## "Apples",
## 2010,
## "West",
## 89,
## 76,
## 13,
## "2010-12-31"
## ],
## [
## "Oranges",
## 2008,
## "East",
## 96,
## 81,
## 15,
## "2008-12-31"
## ],
## [
## "Bananas",
## 2008,
## "East",
## 85,
## 76,
## 9,
## "2008-12-31"
## ],
## [
## "Oranges",
## 2009,
## "East",
## 93,
## 80,
## 13,
## "2009-12-31"
## ],
## [
## "Bananas",
## 2009,
## "East",
## 94,
## 78,
## 16,
## "2009-12-31"
## ],
## [
## "Oranges",
## 2010,
## "East",
## 98,
## 91,
## 7,
## "2010-12-31"
## ],
## [
## "Bananas",
## 2010,
## "East",
## 81,
## 71,
## 10,
## "2010-12-31"
## ]
## ];
## data.addColumn('string','Fruit');
## data.addColumn('number','Year');
## data.addColumn('string','Location');
## data.addColumn('number','Sales');
## data.addColumn('number','Expenses');
## data.addColumn('number','Profit');
## data.addColumn('string','Date');
## data.addRows(datajson);
## return(data);
## }
##
## // jsDrawChart
## function drawChartMotionChartID2bc62925ee46() {
## var data = gvisDataMotionChartID2bc62925ee46();
## var options = {};
## options["width"] = [600];
## options["height"] = [400];
## options["state"] = [""];
##
##
## var chart = new google.visualization.MotionChart(
## document.getElementById('MotionChartID2bc62925ee46')
## );
## chart.draw(data,options);
##
##
## }
##
##
## // jsDisplayChart
## (function() {
## var pkgs = window.__gvisPackages = window.__gvisPackages || [];
## var callbacks = window.__gvisCallbacks = window.__gvisCallbacks || [];
## var chartid = "motionchart";
##
## // Manually see if chartid is in pkgs (not all browsers support Array.indexOf)
## var i, newPackage = true;
## for (i = 0; newPackage && i < pkgs.length; i++) {
## if (pkgs[i] === chartid)
## newPackage = false;
## }
## if (newPackage)
## pkgs.push(chartid);
##
## // Add the drawChart function to the global list of callbacks
## callbacks.push(drawChartMotionChartID2bc62925ee46);
## })();
## function displayChartMotionChartID2bc62925ee46() {
## var pkgs = window.__gvisPackages = window.__gvisPackages || [];
## var callbacks = window.__gvisCallbacks = window.__gvisCallbacks || [];
## window.clearTimeout(window.__gvisLoad);
## // The timeout is set to 100 because otherwise the container div we are
## // targeting might not be part of the document yet
## window.__gvisLoad = setTimeout(function() {
## var pkgCount = pkgs.length;
## google.load("visualization", "1", { packages:pkgs, callback: function() {
## if (pkgCount != pkgs.length) {
## // Race condition where another setTimeout call snuck in after us; if
## // that call added a package, we must not shift its callback
## return;
## }
## while (callbacks.length > 0)
## callbacks.shift()();
## } });
## }, 100);
## }
##
## // jsFooter
## </script>
##
## <!-- jsChart -->
## <script type="text/javascript" src="https://www.google.com/jsapi?callback=displayChartMotionChartID2bc62925ee46"></script>
##
## <!-- divChart -->
##
## <div id="MotionChartID2bc62925ee46"
## style="width: 600; height: 400;">
## </div>
## <div><span>Data: Fruits • Chart ID: <a href="Chart_MotionChartID2bc62925ee46.html">MotionChartID2bc62925ee46</a> • <a href="https://github.com/mages/googleVis">googleVis-0.6.0</a></span><br />
## <!-- htmlFooter -->
## <span>
## R version 3.3.1 (2016-06-21)
## • <a href="https://developers.google.com/terms/">Google Terms of Use</a> • <a href="https://google-developers.appspot.com/chart/interactive/docs/gallery/motionchart">Documentation and Data Policy</a>
## </span></div>
## </body>
## </html>
print(M, 'chart', file='myfilename.html')
results="asis" in the chunk optionsdemo(googleVis)