- Shiny is a platform for creating interactive R programs embedded into a web page.
- Suppose that you create a prediction algorithm, with shiny you can very easily create web input form that calls R and thus your prediction algorithm and displays the results.
- Using Shiny, the time to create simple, yet powerful, web-based interactive data products in R is minimized.
- However, it lacks the flexibility of full featured (and more complex) solutions.
- Shiny is made by the fine folks at R Studio.
Shiny
Data Products
Brian Caffo, Jeff Leek, Roger Peng
Johns Hopkins Bloomberg School of Public Health
What is Shiny?
Some mild prerequisites
- Shiny doesn't really require it, but as with all web programming, a little knowledge of html, css and js is very helpful
- html gives a web page structure and sectioning as well as markup instructions
- css gives the style
- js for interactivity
- There are too many tutorials online to count for getting basic proficiency in these topics to count.
- Shiny uses bootstrap (no relation to the statistics bootstrap) style, which (to me) seems to look nice and renders well on mobile platforms
What else is out there?
- Creating any solution requiring fairly deep knowledge of web client/server programming
- OpenCPU by Jerome Ooms, is a really neat project providing an API for calling R from web documents
- And he even hosts an OpenCPU server, but you can create your own
Context
- You created a novel prediction algorithm to predict risk for developing
diabetes.
- You're hoping patients and caregivers will be able to enter their data and, if needed, take preventative measures.
- You want to create a web site so that users can input the relevant predictors and obtain their prediction.
- Your prediction algorithm (ok, so you're not going to be saving the world with this one)
diabetesRisk <- function(glucose) glucose/200
Getting started
- Make sure you have the latest release of R installed
- If on windows, make sure that you have Rtools installed
install.packages("shiny")libray(shiny)- Great tutorial at http://rstudio.github.io/shiny/tutorial/
- Basically, this lecture is walking through that tutorial offering some of our insights
- Note, some of the proposed interactive plotting uses of Shiny could be handled by the very simple
manipulatefunction rstudio manipulate - Also,
rChartsis will be covered in a different lecture.
A Shiny project
- A shiny project is a directory containing at least two parts
- One named ui.R (for user interface) controls how it looks.
- One named server.R that controls what it does.
ui.R
library(shiny)
shinyUI(pageWithSidebar(
  headerPanel("Data science FTW!"),
  sidebarPanel(
    h3('Sidebar text')
  ),
  mainPanel(
      h3('Main Panel text')
  )
))
server.r
library(shiny)
shinyServer(
  function(input, output) {
  }
)
To run it
- In R, change to the directories with these files and type
runApp() - or put the path to the directory as an argument
- It should open an browser window with the app running

R functions for HTML markup
ui.R
shinyUI(pageWithSidebar(
  headerPanel("Illustrating markup"),
  sidebarPanel(
      h1('Sidebar panel'),
      h1('H1 text'),
      h2('H2 Text'),
      h3('H3 Text'),
      h4('H4 Text')

  ),
  mainPanel(
      h3('Main Panel text'),
      code('some code'),
      p('some ordinary text')
  )
))

Illustrating inputs ui.R
shinyUI(pageWithSidebar(
  headerPanel("Illustrating inputs"),
  sidebarPanel(
    numericInput('id1', 'Numeric input, labeled id1', 0, min = 0, max = 10, step = 1),
    checkboxGroupInput("id2", "Checkbox",
                   c("Value 1" = "1",
                     "Value 2" = "2",
                     "Value 3" = "3")),
    dateInput("date", "Date:")
  ),
  mainPanel(

  )
))

Part of ui.R
  mainPanel(
        h3('Illustrating outputs'),
        h4('You entered'),
        verbatimTextOutput("oid1"),
        h4('You entered'),
        verbatimTextOutput("oid2"),
        h4('You entered'),
        verbatimTextOutput("odate")
  )
server.R
shinyServer(
  function(input, output) {
    output$oid1 <- renderPrint({input$id1})
    output$oid2 <- renderPrint({input$id2})
    output$odate <- renderPrint({input$date})
  }
)

Let's build our prediction function
shinyUI(
  pageWithSidebar(
    # Application title
    headerPanel("Diabetes prediction"),

    sidebarPanel(
      numericInput('glucose', 'Glucose mg/dl', 90, min = 50, max = 200, step = 5),
      submitButton('Submit')
    ),
    mainPanel(
        h3('Results of prediction'),
        h4('You entered'),
        verbatimTextOutput("inputValue"),
        h4('Which resulted in a prediction of '),
        verbatimTextOutput("prediction")
    )
  )
)
server.R
diabetesRisk <- function(glucose) glucose / 200

shinyServer(
  function(input, output) {
    output$inputValue <- renderPrint({input$glucose})
    output$prediction <- renderPrint({diabetesRisk(input$glucose)})
  }
)
The result

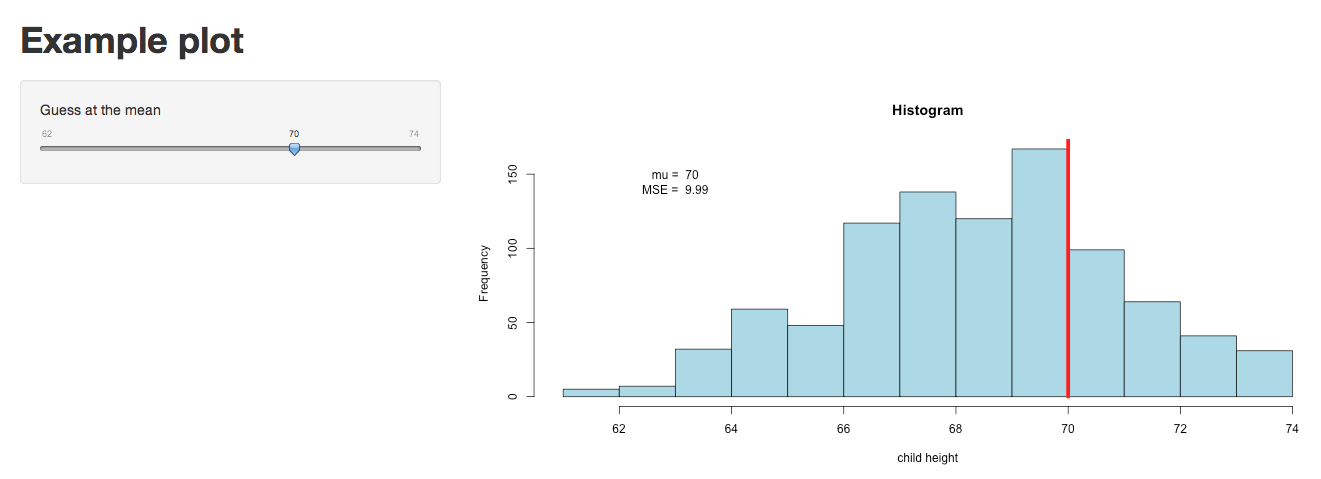
Image example
- Let's build an example with an image
- How about we create a histogram of data
- Put a slider on so that the user has to guess the mean
ui.R
shinyUI(pageWithSidebar(
  headerPanel("Example plot"),
  sidebarPanel(
    sliderInput('mu', 'Guess at the mean',value = 70, min = 62, max = 74, step = 0.05,)
  ),
  mainPanel(
    plotOutput('newHist')
  )
))
server.R
library(UsingR)
data(galton)

shinyServer(
  function(input, output) {
    output$newHist <- renderPlot({
      hist(galton$child, xlab='child height', col='lightblue',main='Histogram')
      mu <- input$mu
      lines(c(mu, mu), c(0, 200),col="red",lwd=5)
      mse <- mean((galton$child - mu)^2)
      text(63, 150, paste("mu = ", mu))
      text(63, 140, paste("MSE = ", round(mse, 2)))
      })

  }
)
The output
Tighter control over style
- All of the style elements are handled through ui.R
- Instead, you can create a www directory and then an index.html file in that directory
- This link goes through the html needed
- You just have to have specific js libraries and appropriately name ids and classes. This is beyond the scope of this class
- For students with a lot of experience in html, js, css it would be a breeze and probably easier and more flexible than the R html controls in ui.R
Other things Shiny can do
- Allow users to upload or download files
- Have tabbed main panels
- Have editable data tables
- Have a dynamic UI
- User defined inputs and outputs
- Put a submit button so that Shiny only executes complex code after user hits submit
Distributing a Shiny app
- The quickest way is to send (or put on github or gist or dropbox or whatever) someone the app directory and they can then call
runApp - You could create an R package and create a wrapper that calls
runApp
- Of course, these solutions only work if the user knows R
- Another option is to run a shiny server
- Requires setting up a (Shiny server)[http://www.rstudio.com/shiny/server/]
- Probably easiest if you use one of the virtual machines where they already have Shiny servers running well (for example, on AWS)
- Setting up a Shiny server is beyond the scope of this class as it involves some amount of linux server administration
- Groups are creating a Shiny hosting services that will presumably eventually be a fee for service or freemium service
- BTW, don't put system calls in your code (this is one of the first things many of us do for fun, but it introduces security concerns)